The Impact of Volatility Targeting on Equities, Bonds, Commodities and Currencies
Authors: Harvey, Hoyle, Korgaonkar, Rattray, Sargaison, Hemert
Title: The Impact of Volatility Targeting
Link: https://papers.ssrn.com/sol3/papers.cfm?abstract_id=3175538
Abstract:
Recent studies show that volatility-managed equity portfolios realize higher Sharpe ratios than portfolios with a constant notional exposure. We show that this result only holds for “risk assets”, such as equity and credit, and link this to the so-called leverage effect for those assets. In contrast, for bonds, currencies, and commodities the impact of volatility targeting on the Sharpe ratio is negligible. However, the impact of volatility targeting goes beyond the Sharpe ratio: it reduces the likelihood of extreme returns, across all asset classes. Particularly relevant for investors, “left-tail” events tend to be less severe, as they typically occur at times of elevated volatility, when a target-volatility portfolio has a relatively small notional exposure. We also consider the popular 60-40 equity-bond “balanced” portfolio and an equity-bond-credit-commodity “risk parity” portfolio. Volatility scaling at both the asset and portfolio level improves Sharpe ratios and reduces the likelihood of tail events.
Notable quotations from the academic research paper:
"One of the key features of volatility is that it is persistent, or “clusters”. High volatility over the recent past tends to be followed by high volatility in the near future. This observation underpins Engle’s (1982) pioneering work on ARCH models. In this paper, we study the risk and return characteristics of assets and portfolios that are designed to counter the fluctuations in volatility. We achieve this by leveraging the portfolio at times of low volatility, and scaling down at times of high volatility. Effectively the portfolio is targeting a constant level of volatility, rather than a constant level of notional exposure.
While most of the research has concentrated on equity markets, we investigate the impact of volatility targeting across more than 60 assets, with daily data beginning as early as 1926. We find that Sharpe ratios are higher with volatility scaling for risk assets (equities and credit), as well as for portfolios that have a substantial allocation to these risk assets, such as a balanced (60-40 equity-bond) portfolio and a risk parity (equity-bond-credit-commodity) portfolio.
Risk assets exhibit a so-called leverage effect, i.e., a negative relation between returns and volatility, and so volatility scaling effectively introduces some momentum into strategies. That is, in periods of negative returns, volatility often increases, causing positions to be reduced, which is in the same direction as what one would expect from a time-series momentum strategy. Historically such a momentum strategy has performed well.
For other assets, such as bonds, currencies, and commodities, volatility scaling has a negligible effect on realized Sharpe ratios.
We show that volatility targeting consistently reduces the likelihood of extreme returns (and the volatility of volatility) across our 60+ assets. Under reasonable investor preferences, a thinner left tail is much preferred (for a given Sharpe ratio). Volatility targeting also reduces the maximum drawdowns for both the balanced and risk parity portfolio.
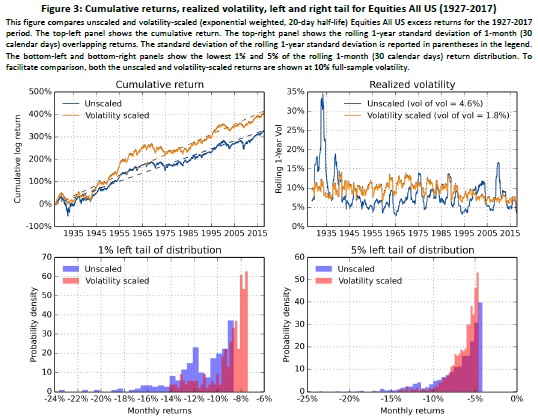
In Figure 3, we further compare unscaled and volatility-scaled returns, where the latter uses a volatility estimate based on a half-life of 20 days. In the top-left panel, we plot the cumulative return, which shows that the volatility-scaled investment generally outperformed, except during the middle part of the sample period. The impact of volatility scaling is illustrated in the top-right panel, where we depict the rolling 1-year realized volatility for both unscaled and volatility-scaled 30-day overlapping returns. The realized volatility of volatility-scaled returns is much more stable over time. This is also evident from the vol of vol metric (i.e., the standard deviation of the rolling 1-year realized volatility) reported in the legend: 4.6% for unscaled returns versus 1.8% for volatility-scaled returns. Finally, in the bottom-left and bottom-right panels we show the lowest 1% and 5% of the 1-month (30-calendar days) return distribution.19 Very negative returns of, say, -10% or worse are more common for unscaled returns.
To summarize, Figure 3 illustrates the two main ways volatility scaling has helped an Equities All US investment: first, it improves the risk-adjusted performance, and second, it reduces the left tail.
"
Are you looking for more strategies to read about? Sign up for our newsletter or visit our Blog or Screener.
Do you want to learn more about Quantpedia Premium service? Check how Quantpedia works, our mission and Premium pricing offer.
Do you want to learn more about Quantpedia Pro service? Check its description, watch videos, review reporting capabilities and visit our pricing offer.
Do you want algorithmic access to the full Quantpedia database via the API? Subscribe to Quantpedia Pro, ask for an API key, and explore the in/out-of-sample statistics, source academic papers, and code snippets — ideal for quantitative research, systematic trading workflows, and AI model training.
Are you looking for historical data or backtesting platforms? Check our list of Algo Trading Discounts.
Or follow us on:
Facebook Group, Facebook Page, Twitter, Linkedin, Medium or Youtube
Share onLinkedInTwitterFacebookRefer to a friend