We’ve already analyzed tens of thousands of financial research papers and identified more than 700 attractive trading systems together with hundreds of related academic papers.
Browse Strategies- Unlocked Screener & 300+ Advanced Charts
- 700+ uncommon trading strategy ideas
- New strategies on a bi-weekly basis
- 2000+ links to academic research papers
- 500+ out-of-sample backtests
- Design multi-factor multi-asset portfolios
Upgrade subscription
Pairs trading (sometimes also known as statistical arbitrage) is a very popular trading strategy between traders, and it has become a favorite strategy for investigation by financial academics. The most well-known variant is stock’s pairs trading where the trader buys and simultaneously sells two stocks (that follow each other) when they diverge from the normal synchronized moves.
The equity universe is broad, and therefore, it is time-consuming to look for pairs that are correlated or cointegrated (aka. they move together). ETFs provide a much smaller universe, and they have one great advantage (compared to stocks) – the ETF is a portfolio of stocks and is, therefore, more resilient to unexpected news related to a single stock (this often breaks a promising convergence in stock’s pairs). Pairs trading on country ETFs is, therefore, an easy and promising version of a pairs trading strategy.
Fundamental reason
As prices in a pair of ETFs were closely cointegrated in the past, there is a high probability those two securities share common sources of fundamental return correlations. A temporary shock could move one ETF out of the common price band. This presents a statistical arbitrage opportunity. The universe of pairs is continuously updated, which ensures that pairs which no longer move in synchronicity are removed from trading, and only pairs with a high probability of convergence remain.
- Unlocked Screener & 300+ Advanced Charts
- 700+ uncommon trading strategy ideas
- New strategies on a bi-weekly basis
- 2000+ links to academic research papers
- 500+ out-of-sample backtests
- Design multi-factor multi-asset portfolios
Backtest period from source paper
1996-2009
Confidence in anomaly's validity
Weak
Indicative Performance
20.6%
Notes to Confidence in Anomaly's Validity
OOS back-test shows significantly negative performance. It looks, that in sample back-test from source research paper might have been data mined.
Notes to Indicative Performance
per annum, annualized (geometrically) daily return 0,075% (data from table 3B – one day waiting period, 5 top pairs selected)
Period of Rebalancing
Daily
Notes to Period of Rebalancing
Notes to Estimated Volatility
estimated annualized daily volatility (data from table 3B – one day waiting period, 5 top pairs selected)
Number of Traded Instruments
22
Notes to Number of Traded Instruments
Notes to Maximum drawdown
Complexity Evaluation
Moderately complex strategy
Notes to Complexity Evaluation
Financial instruments
ETFs
Simple trading strategy
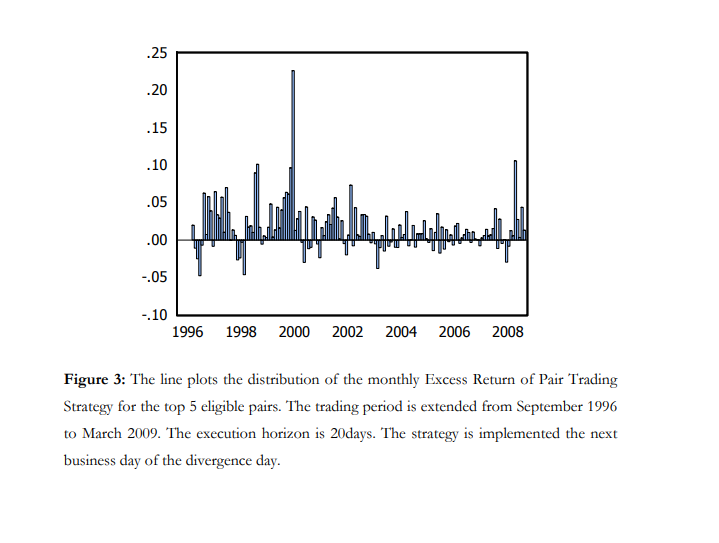
The investment universe consists of 22 international ETFs. A normalized cumulative total return index is created for each ETF (dividends included), and the starting price during the formation period is set to $1 (price normalization). The selection of pairs is made after a 120 day formation period. Pair’s distance for all ETF pairs is calculated as the sum of squared deviations between two normalized price series. The top 5 pairs with the smallest distance are used in the subsequent 20 day trading period. The strategy is monitored daily, and trade is opened when the divergence between the pairs exceeds 0.5x the historical standard deviation. Investors go long on the undervalued ETF and short on the overvalued ETF. The trade is exited if a pair converges or after 20 days (if the pair does not converge within the next 20 business days). Pairs are weighted equally, and the portfolio is rebalanced on a daily basis.
Hedge for stocks during bear markets
No - Based on the source research paper, the strategy has a small but still positive correlation to the equity market; therefore probably can’t be used as a hedge/diversification to equity market risk factor during bear markets.
Out-of-sample strategy's implementation/validation in QuantConnect's framework
(chart+statistics+code)